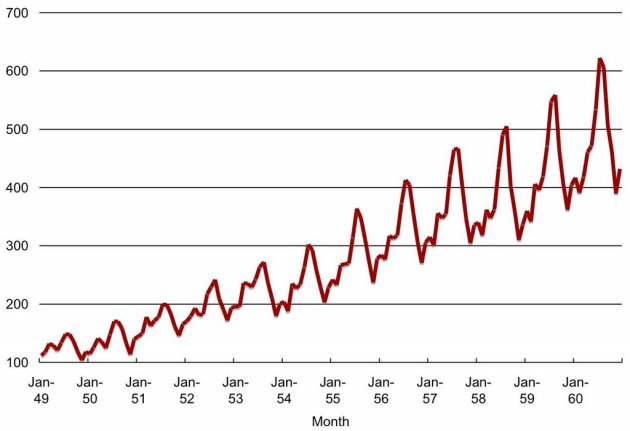
 When we have a series of data points indexed in time order we can define that as a “Time Series”. Most commonly, a time series is a sequence taken at successive equally spaced points in time. Monthly rainfall data, temperature data of a certain place are some examples for time series.
In the field of predictive analytics, there are many incidents that need to analyze time series data and forecast the future values of that based on the previous values. Think of a scenario where you’ve to do a time series prediction for your business data or an incident where part of your predictive experiment contains a time series field that need to predict the future data points… There are many algorithms and machine learning models that you can use for forecasting time series values.
Multi-layer perception, Bayesian neural networks, radial basis functions, generalized regression neural networks (also called kernel regression), K-nearest neighbor regression, CART regression trees, support vector regression, and Gaussian processes are some machine learning algorithms that can be used for time series forecasting.
See here for more about these methods
Autoregressive Moving Average (ARIMA), Seasonal-ARIMA, Exponential smoothing (ETS) are some algorithms that widely used for this kind of time series analysis. I’m not going to dig deep into the algorithms, trend analysis and all numbers & characteristics bound with time series. Just going to demonstrate a simple way that you can do time series analysis in your deployments using Azure ML Studio.
After adding a dataset that contains a time series data into AzureML Studio, you can perform the time series analysis and predictions by using python or R scripts. In addition to that ML Studio offers a pre-built module for Anomaly detection of time series datasets. It can learn the normal characteristics of the provided time series and detect deviations from the normal pattern.
Here I’ve used forecast R package to write code snippets enabling AzureML Studio to do TS forecasting using popular time series algorithms namely as ARIMA, Seasonal ARIMA and ETS.
ARIMA seasonal & ARIMA non-seasonal
#ARIMA Seasonal / ARIMA non-seasonal
library(forecast)
# Map 1-based optional input ports to variables
dataset1 <- maml.mapInputPort(1) # class: data.frame
dataset2 <- maml.mapInputPort(2) # class: data.frame

#Enter the seasonality of the timeseries here
#For non-seasonal model use '1' as the seasonality
seasonality<-12
labels <- as.numeric(dataset1$data)
timeseries <- ts(labels,frequency=seasonality)
model <- auto.arima(timeseries)
numPeriodsToForecast <- ceiling(max(dataset2$date)) - ceiling(max(dataset1$date))
numPeriodsToForecast <- max(numPeriodsToForecast, 0)
forecastedData <- forecast(model, h=numPeriodsToForecast)
forecastedData <- as.numeric(forecastedData$mean)

output <- data.frame(date=dataset2$date,forecast=forecastedData)
data.set <- output

# Select data.frame to be sent to the output Dataset port
maml.mapOutputPort("data.set");
ETS seasonal & ETS non-seasonal
#ETS seasonal / ETS non-seasonal
library(forecast)
# Map 1-based optional input ports to variables
dataset1 <- maml.mapInputPort(1) # class: data.frame
dataset2 <- maml.mapInputPort(2) # class: data.frame

#Add the seasonality here
#Assign seasonality as 'a' for non-seasonal ETS
seasonality<-12
labels <- as.numeric(dataset1$data)
timeseries <- ts(labels,frequency=seasonality)
model <- ets(timeseries)
numPeriodsToForecast <- ceiling(max(dataset2$date)) - ceiling(max(dataset1$date))
numPeriodsToForecast <- max(numPeriodsToForecast, 0)
forecastedData <- forecast(model, h=numPeriodsToForecast)
forecastedData <- as.numeric(forecastedData$mean)

output <- data.frame(date=dataset2$date,forecast=forecastedData)
data.set <- output

# Select data.frame to be sent to the output Dataset port
maml.mapOutputPort("data.set");
The advantage of using R script for the prediction is the ability of customizing the script as you want. But if you want looking for an instant solution for doing time series prediction, there’s a custom module in Cortana Intelligence gallery to do time series forecasting.
https://gallery.cortanaintelligence.com/Experiment/Time-Series-Forecasting-using-Custom-Modules-1
You just have to open that in your studio and re-use the built modules in your experiment. See what’s happening to your sales in next December! 🙂

Hello,
We want to predict Gas price using historical data that contains data for one company.
But we need to predict increase/decrease in price of gas based on historical data using forecasting. For eg: The price of Gas in 2016 is 2.086917, now it should predict price of upcoming year. We are confused over here, can anyone suggest, how to do this?
(we are creating demo experiment for our internal use only.)
LikeLike
You can do this using either regression or time series forecasting (I think regression would work better here)
Identify the data factors that affect for the price of gas. Then build a model using those data.
LikeLike
Hello,
Thanks for your response.
We have created one experiment using regression only, but I think its not giving me the proper output.
Can you plz check it once at below link:
https://gallery.cortanaintelligence.com/Experiment/GasPricePredictionExp-2
LikeLike
Hello Haritha,
Actually we want to implement gas price prediction experiment like this can u plz help me:
https://www.toptal.com/machine-learning/predicting-gas-prices-using-azure-machine-learning-studio
LikeLike
Hello Haritha,
Actually we want to implement gas price prediction experiment like this can u plz help me:
https://www.toptal.com/machine-learning/predicting-gas-prices-using-azure-machine-learning-studio
LikeLike
Hello Haritha,
Actually we want to implement gas price prediction experiment like this can u plz help me:
https://www.toptal.com/machine-learning/predicting-gas-prices-using-azure-machine-learning-studio
LikeLike
In this example, there are two input features that has been chosen as the inputs of the predictive model (price of oil, and currency rate under USD/HRK). So it’s more accurate when building the regression model.
In your case, there’s only a single input feature which is really hard to build up an accurate regression model.
LikeLike
Hello Haritha,
Can you Plz explain how to use Custom modules Like “Train score Timeseries , Score Timeseries and Evaluate Timeseries ” in our experiment ?
LikeLike